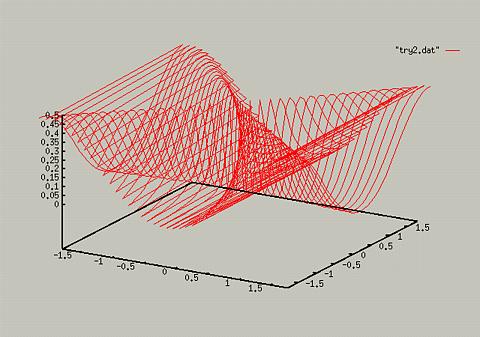
-2.000000	-2.000000	0.500000
-2.000000	-1.500000	0.427300
-2.000000	-1.000000	0.235294
-2.000000	-0.500000	0.062257
-2.000000	 0.000000	0.000000
-2.000000	 0.500000	0.062257
-2.000000	 1.000000	0.235294
-2.000000	 1.500000	0.427300
-2.000000	 2.000000	0.500000
-1.500000	-2.000000	0.427300
-1.500000	-1.500000	0.500000
-1.500000	-1.000000	0.371134
-1.500000	-0.500000	0.109756
-1.500000	 0.000000	0.000000
-1.500000	 0.500000	0.109756
-1.500000	 1.000000	0.371134
-1.500000	 1.500000	0.500000
-1.500000	 2.000000	0.427300
-1.000000	-2.000000	0.235294
-1.000000	-1.500000	0.371134
-1.000000	-1.000000	0.500000
-1.000000	-0.500000	0.235294
...
To plot this data, if it were in a file called "try2.dat", you would type:
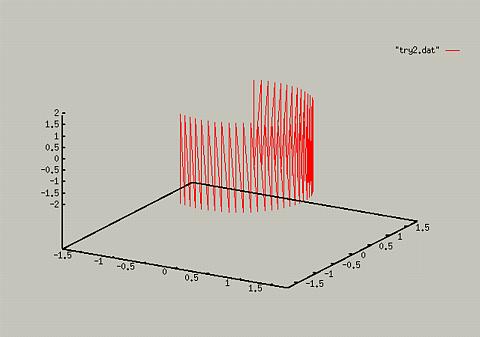
You can also use cylindrical and spherical coordiantes with 3D data plots. For example:
For more information, see help plot datafile.
Copyright © 1996 College of Natural Sciences. All Rights Reserved.
Last Modified: 11/5/96